See where the smart money
is positioned — as it happens.
A live broad-market heatmap, dealer gamma, OI walls on the chart, order flow, volatility and custom studies — for NIFTY, SENSEX & BANK NIFTY. Built on live market data. Descriptive intelligence, not tips.
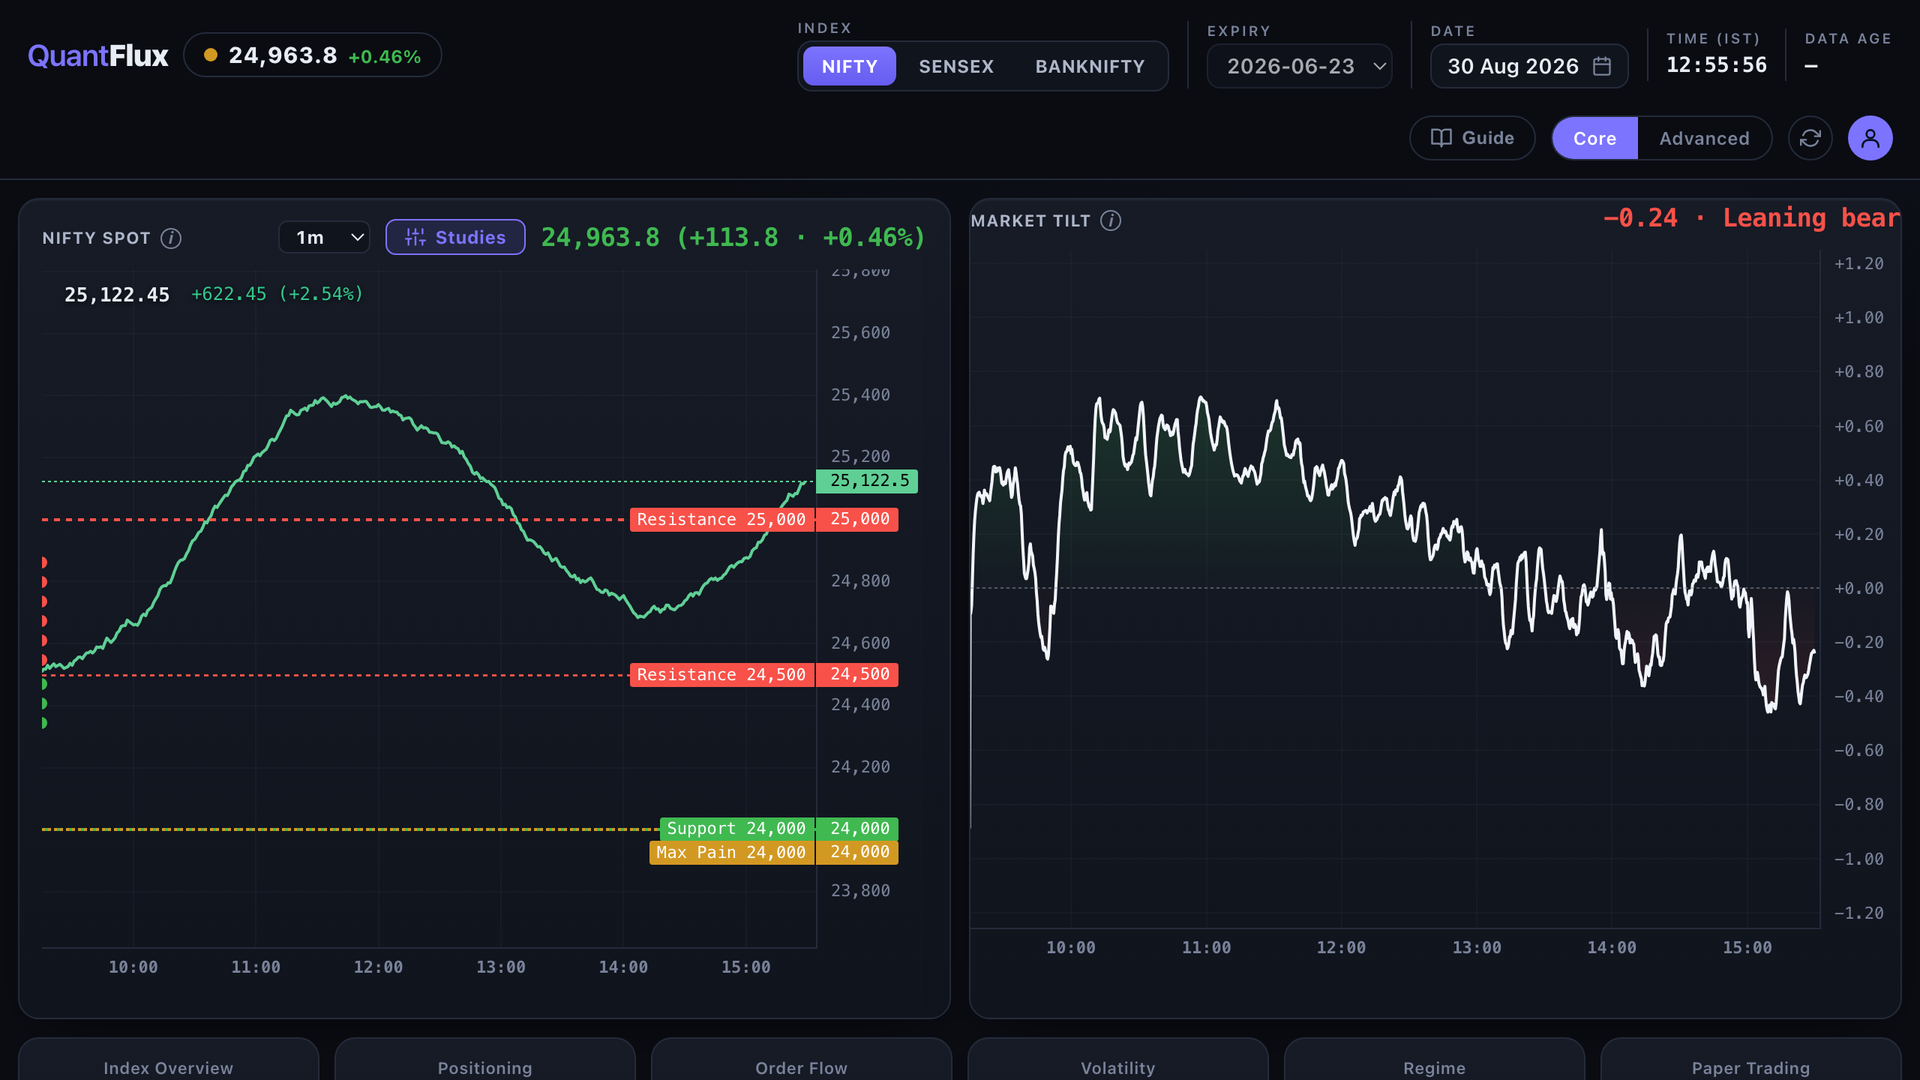
The full options picture — beginner-readable.
Eight tools that turn the option chain, the tape and the whole market into something you can actually read.
Index Overview NEW
A weight-sized constituent heatmap with breadth and what's moving the index — the whole market at a glance.
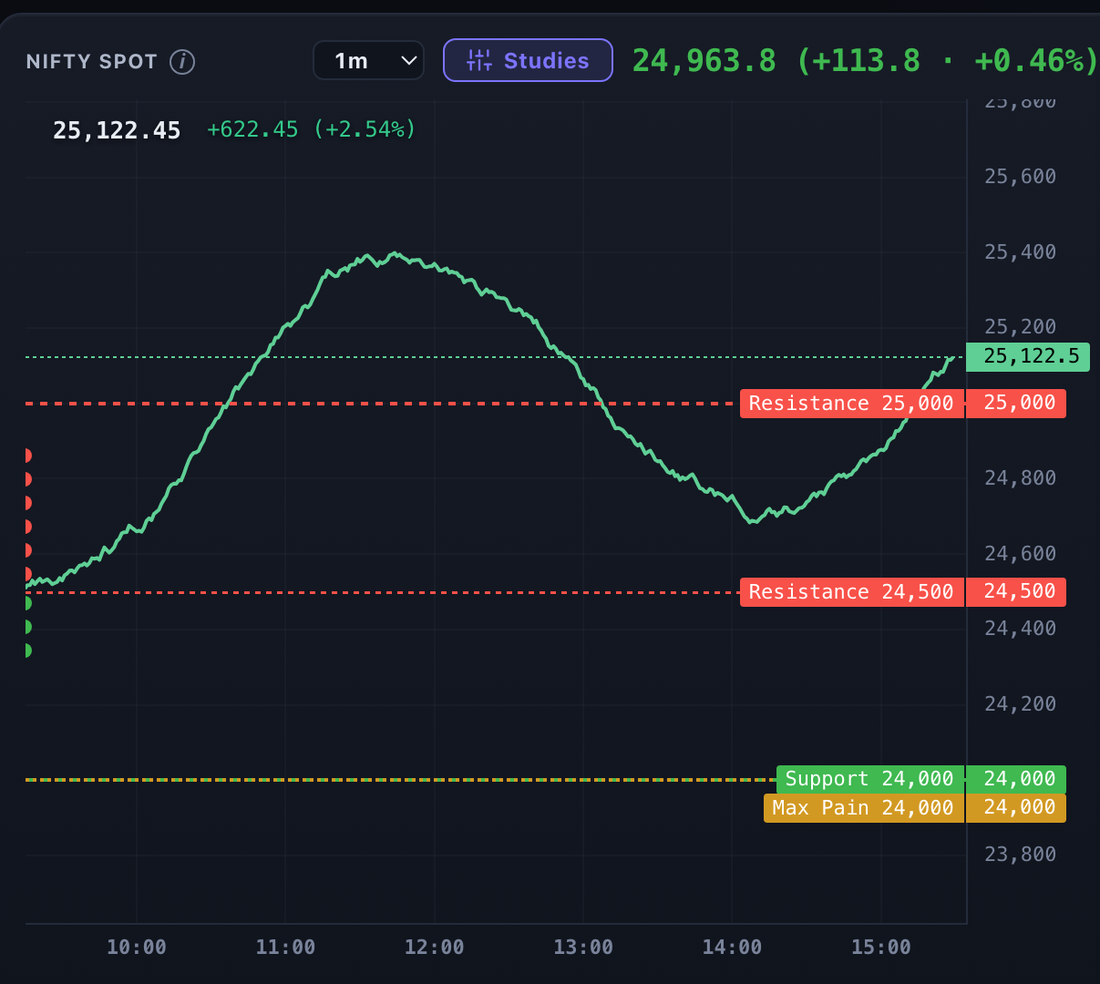
OI Profile NEW
Call vs put open-interest walls pinned right to the price axis, so you see support & resistance on the chart.
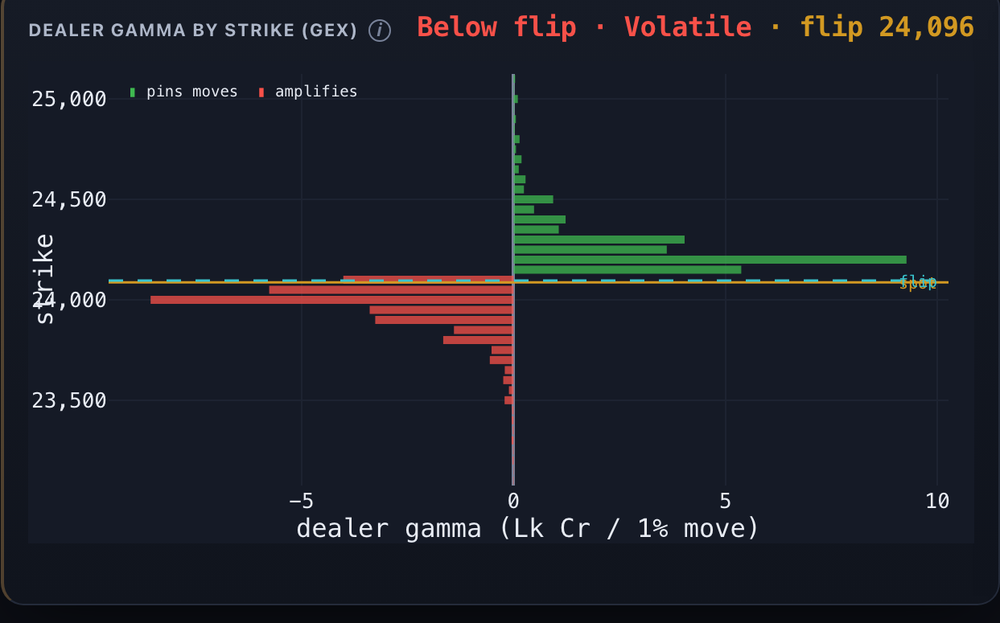
Dealer Gamma & Regime
GEX by strike, the gamma flip and DEX — and whether the tape is pinned, trending or volatile.
Order Flow
VWAP with σ-bands, CVD, OFI and resting-depth SOI — from the real futures tape and the order book.
Custom Studies NEW
TradingView-style overlays & stacked sub-panes — 20 studies, line / area / candles, any timeframe.
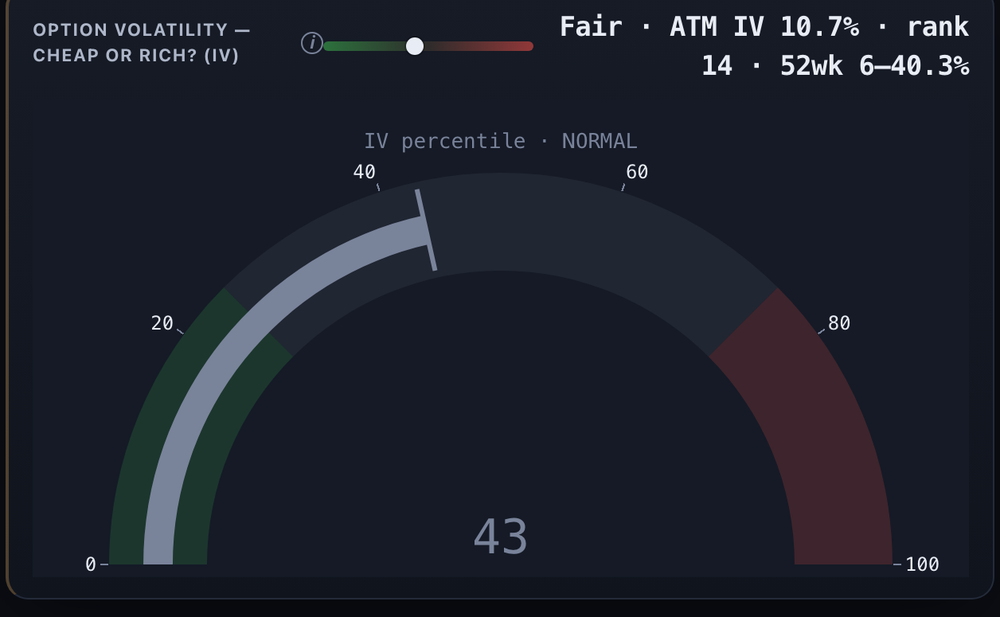
Expected Move & IV
The ±1σ band the options market is pricing, ATM IV cheap-or-rich, and put-call parity dislocations.
Structural Events + Pulse
A plain-English feed of OI-flow surges & lead flips, distilled to one live market-tilt score.
Paper Trading NEW
Practise with a virtual wallet — live P&L and a trade journal. No real money, no risk.
The metrics the desks watch — now in your hands.

Start simple. Go deep when you're ready.
A Core view keeps only the essentials; flip to Advanced for the full order-flow depth. And every metric has a plain-English explainer — what it means and how to read it — in the Metrics Guide.
Stop staring at the LTP.
Start reading the tape.
The heatmap, dealer gamma, order flow and positioning the desks watch. Try it all free for 7 days.
Important: QuantFlux is an informational/educational analytics tool — it describes market positioning and does not provide investment advice or buy/sell recommendations, and is not a SEBI-registered adviser. Derivatives carry substantial risk; do your own research.